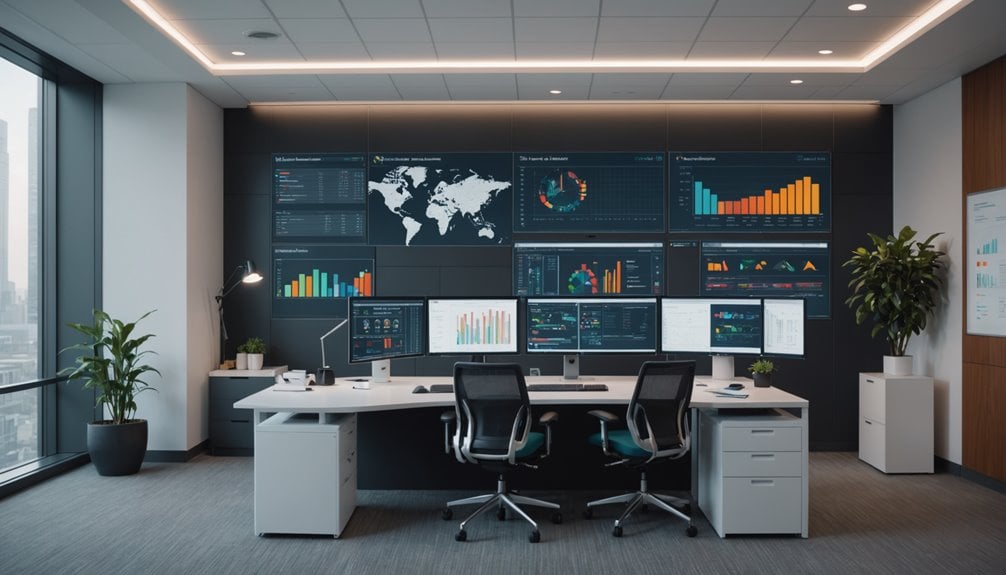
A pharmaceutical deviation trending analysis dashboard helps you monitor, track, and analyze quality issues in your manufacturing process. You’ll see real-time visualizations of deviation patterns through charts and heat maps, allowing for quick decision-making and proactive risk management. These tools categorize deviations by type, severity, and department while enabling root cause analysis. Effective dashboards greatly reduce investigation time and enhance regulatory compliance, transforming how you prevent costly quality issues.
Key Takeaways
Contents
- 1 Key Takeaways
- 2 Core Components of Pharmaceutical Deviation Analysis Dashboards
- 3 Benefits of Real-Time Deviation Trend Visualization
- 4 Implementation Strategies for Effective Deviation Monitoring
- 5 Key Performance Indicators for Quality Management Systems
- 6 Regulatory Compliance and Reporting Capabilities
- 7 Case Studies: Deviation Dashboard Success Stories
- 8 Future Trends in Pharmaceutical Deviation Analytics
- 9 Frequently Asked Questions
- 9.1 How Much Does a Pharmaceutical Deviation Trending Dashboard Typically Cost?
- 9.2 Can Deviation Dashboards Integrate With Legacy Pharmaceutical Production Systems?
- 9.3 What Team Members Should Manage the Deviation Trending Dashboard?
- 9.4 How Long Does Dashboard Implementation and Staff Training Take?
- 9.5 Are Cloud-Based Deviation Trending Solutions Secure for Pharmaceutical Data?
- 10 Conclusion
- A pharmaceutical deviation trending analysis dashboard is a real-time visualization tool that tracks quality issues by type, severity, and department.
- It empowers decision-making through charts, graphs, and heat maps that identify patterns in manufacturing deviations over time.
- The dashboard integrates with existing quality management systems to provide actionable intelligence on recurring problems.
- It features automated alerts when deviation thresholds are exceeded, enabling proactive quality risk management.
- Dashboards enhance regulatory compliance by organizing deviation data for inspections and supporting root cause analysis.
Core Components of Pharmaceutical Deviation Analysis Dashboards
To effectively monitor and analyze deviations in pharmaceutical manufacturing, robust dashboards must contain several essential components.
You’ll need categorized deviation tracking that classifies issues by type, severity, and department to identify recurring problems. Real-time data visualization tools should display information through charts, graphs, and heat maps, making complex patterns immediately recognizable.
Your dashboard should feature thorough trend analysis capabilities that detect patterns over time, allowing you to spot emerging issues before they become critical.
Include root cause analysis tools that help identify underlying factors contributing to deviations. Additionally, incorporate regulatory compliance tracking to guarantee alignment with GMP standards and other requirements.
Finally, implement automated alert systems that notify relevant personnel when deviation thresholds are exceeded, enabling prompt corrective actions.
Benefits of Real-Time Deviation Trend Visualization
Real-time visualization of deviation trends empowers your team to make rapid decisions when quality issues emerge, potentially saving thousands in product losses and regulatory penalties.
You’ll identify patterns and correlations between seemingly unrelated deviations that might otherwise go unnoticed until they become serious problems. These insights create valuable opportunities for preventive actions, allowing you to address root causes before they manifest into critical compliance issues or affect product quality.
Rapid Decision Making
When pharmaceutical teams have access to real-time deviation trend visualization, they gain a significant competitive advantage in decision-making speed. You’ll notice immediate improvements in your rapid response capabilities as the dashboard highlights critical issues requiring attention. Decision frameworks become more robust when backed by visualization tools that categorize deviations by severity, frequency, and impact.
| Decision Type | Without Dashboard | With Dashboard |
|---|---|---|
| Quality Alert | Hours of analysis | Immediate action |
| Resource Allocation | Guesswork | Data-driven priority |
| Compliance Risk | Reactive stance | Proactive prevention |
Your team can now address emerging patterns before they escalate into serious compliance issues. The dashboard transforms complex deviation data into actionable insights, enabling you to make confident decisions in minutes rather than days—significantly reducing quality risks and operational downtime.
Preventive Action Opportunities
Identifying patterns before they develop into significant deviations gives your quality team unprecedented preventive capabilities. Your dashboard transforms data into actionable intelligence, allowing you to implement preventive measures before minor issues cascade into major compliance problems.
You’ll notice that trending analysis highlights recurring issues across manufacturing lines, shifts, or materials. This insight enables targeted risk assessment and resource allocation where they’ll have maximum impact. Rather than constantly reacting to problems, you’re now positioned to prevent them.
The dashboard’s visualization tools help you spot correlations between seemingly unrelated factors that contribute to deviations. By addressing these root causes proactively, you’ll reduce investigation time, minimize batch rejections, and maintain higher compliance standards.
Your quality system transforms from reactive to predictive, improving both regulatory standing and operational efficiency.
Implementation Strategies for Effective Deviation Monitoring
Successful implementation of deviation monitoring systems requires careful planning and strategic deployment across your pharmaceutical operations.
You’ll need to establish detailed deviation categories that align with regulatory requirements while reflecting your facility’s unique processes.
Begin by mapping critical control points in your production workflow where deviations are most likely to occur. Implement both automated and manual monitoring techniques to capture data at these points.
Your dashboard should integrate with existing quality management systems to eliminate duplicate data entry and guarantee consistent tracking.
Train your team thoroughly on classification criteria and reporting procedures to maintain data integrity.
Consider a phased approach—start with high-risk processes before expanding to your entire operation.
Remember to establish clear ownership of deviation monitoring, assigning specific responsibilities for data collection, analysis, and response.
Key Performance Indicators for Quality Management Systems
Effective quality management systems rely on carefully selected Key Performance Indicators (KPIs) that provide measurable insights into your pharmaceutical operations.
These KPIs should track critical aspects like deviation frequency, severity, resolution time, and recurrence rates, allowing you to spot concerning trends before they become regulatory issues.
When establishing quality metrics, focus on both leading indicators (preventive measures) and lagging indicators (outcome measurements).
You’ll need to set compliance benchmarks based on historical performance, industry standards, and regulatory expectations. Set alert thresholds that trigger investigations when metrics deviate considerably from established norms.
Remember that your KPIs must evolve as your operations mature.
Review and refine them quarterly to guarantee they continue to reflect your most critical quality parameters and support continuous improvement in your deviation management processes.
Regulatory Compliance and Reporting Capabilities
Your deviation trending analysis dashboard must integrate robust regulatory alert monitoring systems to instantly notify you of compliance changes affecting your pharmaceutical operations.
The dashboard’s inspection-ready reporting tools will transform raw deviation data into formatted reports that satisfy regulatory agency requirements during audits.
FDA submission capabilities allow you to export properly structured data packages that meet electronic filing standards, streamlining your regulatory reporting obligations.
Regulatory Alert Monitoring Systems
To maintain continuous regulatory compliance, pharmaceutical companies must implement robust Regulatory Alert Monitoring Systems within their deviation trending dashboards. You’ll benefit from real-time notifications whenever regulatory updates impact your operations, ensuring you’re never caught off-guard by new compliance requirements.
| Alert Type | Function | Response Time |
|---|---|---|
| Critical | Flags immediate compliance risks | Within 24 hours |
| Advisory | Highlights upcoming regulatory changes | Within 7 days |
| Informational | Provides industry best practices | Within 30 days |
Your dashboard should enable customizable alert thresholds based on deviation severity, frequency, and regulatory relevance. This allows your quality team to prioritize responses effectively while maintaining complete audit readiness. By integrating these monitoring systems, you’ll transform reactive compliance into proactive risk management, greatly reducing potential regulatory exposure.
Inspection-Ready Reporting Tools
Pharmaceutical companies that want to excel during regulatory inspections must implement inspection-ready reporting tools in their deviation trending dashboards. These tools allow you to generate detailed reports with just a few clicks, greatly enhancing your inspection readiness.
When regulators arrive, you’ll immediately access vital deviation data organized according to regulatory expectations.
Modern dashboard reporting tools offer customizable templates that align with FDA, EMA, and other regulatory frameworks. You can configure these tools to automatically highlight important trends, recurring issues, and resolution statuses—elements inspectors typically scrutinize.
This reporting efficiency doesn’t just save time during inspections; it demonstrates your organization’s commitment to quality management.
FDA Submission Capabilities
Three essential FDA submission capabilities should be integrated into any pharmaceutical deviation trending dashboard. You’ll need systems that streamline FDA submission processes while maintaining compliance with changing regulatory requirements. Your dashboard should automatically generate submission-ready reports that align with regulatory submission timelines.
| Capability | Benefit |
|---|---|
| Data extraction | Pulls relevant deviation data for submissions |
| Trend visualization | Shows patterns required by FDA reviewers |
| Automated narratives | Generates compliant deviation explanations |
| CAPA tracking | Links deviations to corrective actions |
| Submission scheduling | Alerts team of upcoming deadlines |
With these capabilities, you’ll reduce submission preparation time by up to 70% while ensuring data integrity. Your dashboard becomes not just an internal monitoring tool but a vital bridge between your quality system and regulatory expectations.
Case Studies: Deviation Dashboard Success Stories
While theoretical discussions provide valuable insights, real-world implementation stories demonstrate the transformative power of deviation dashboards in pharmaceutical manufacturing.
Consider the case of XYZ Pharma, which reduced deviation investigation time by 65% after implementing a customized dashboard. Their quality team identified recurring equipment calibration issues that had previously gone undetected.
Another compelling dashboard success story comes from ABC Biologics, where trending analysis revealed subtle patterns in temperature excursions across multiple batches. By addressing the root cause, they prevented a potential recall worth millions.
These deviation case studies show that successful dashboard implementation isn’t merely about technology—it’s about creating actionable intelligence.
Companies that leverage these tools effectively report higher regulatory compliance rates, fewer investigations, and significant cost savings through proactive quality management.
Future Trends in Pharmaceutical Deviation Analytics
As the pharmaceutical industry evolves rapidly, deviation analytics is poised to undergo significant transformation in the coming years.
You’ll see advanced machine learning algorithms automating the identification of deviation patterns, reducing human error and increasing predictive capabilities.
Data integration will become seamless, connecting quality systems, manufacturing execution systems, and laboratory information management systems into unified analytics platforms.
This integration will provide you with thorough deviation insights across your entire operation.
Future dashboards will likely incorporate real-time predictive analytics, allowing you to address potential deviations before they occur.
You’ll also benefit from natural language processing capabilities that can extract valuable insights from unstructured data in deviation reports.
These advancements will help you move from reactive to proactive quality management, ultimately improving product quality and regulatory compliance.
Frequently Asked Questions
How Much Does a Pharmaceutical Deviation Trending Dashboard Typically Cost?
You’ll find dashboard pricing varies widely from $5,000 to $100,000 depending on complexity, features, and customization needs. Conduct a thorough cost analysis before investing in this quality management tool.
Can Deviation Dashboards Integrate With Legacy Pharmaceutical Production Systems?
Yes, your deviation dashboards can integrate with legacy systems through proper system integration solutions that guarantee data compatibility between monitoring tools and older pharmaceutical production environments.
What Team Members Should Manage the Deviation Trending Dashboard?
You’ll want quality assurance leads, production managers, and compliance officers to handle your dashboard oversight. They’ll guarantee proper deviation management through data analysis and corrective action implementation.
How Long Does Dashboard Implementation and Staff Training Take?
You’ll typically need 4-8 weeks for dashboard implementation timeline, with an additional 1-2 weeks dedicated to staff training duration. Plan for a complete onboarding cycle of 6-10 weeks.
Are Cloud-Based Deviation Trending Solutions Secure for Pharmaceutical Data?
You’ll find cloud-based deviation trending solutions secure when they implement robust cloud security protocols and data encryption. They’re designed to protect your sensitive pharmaceutical information while maintaining regulatory compliance.
Conclusion
When you implement a deviation trending analysis dashboard, you’re gaining a powerful tool that transforms complex quality data into actionable insights. You’ll quickly identify emerging patterns, address root causes, and demonstrate regulatory compliance. By investing in this technology, you’re not just monitoring deviations—you’re building a proactive quality culture that continuously improves processes and ultimately enhances patient safety.